Get Started
Learn how to use our interactive developer platform to test, integrate, and master Wawp API in minutes.
Best practices
Start with the /v2/session/create guide to set up your first instance.
Always check the 'Expected Responses' for 4xx errors to build robust error handling.
Use the 'Copy AI Description' button (Icon) to get a full Markdown summary of any endpoint for your AI assistant.
Getting Started: The Interactive Developer Experience
Welcome to the Wawp API platform. This guide is designed to help you navigate our documentation and use the specialized tools we've built to speed up your development process. Our docs aren't just a manual—they are a lived, interactive environment where you can test real requests against your own WhatsApp instances.
If you are new here, we recommend exploring the Session Management Lifecycle to understand how instances work, and the Messaging Overview to see how to send your first message. For non-technical guides and plugin configuration, visit our Help Center.
🚀 1. The Interactive API Tester (Postman-Style)
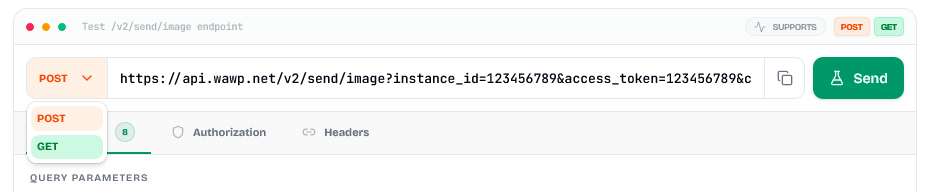
Every endpoint in our documentation comes with a built-in interactive tester. This allows you to execute real API calls without leaving your browser or opening external tools like Postman or Insomnia.
How to use it:
- Method Selector: At the top left of the tester, you can see the HTTP method (POST, GET, etc.). If an endpoint supports multiple methods, you can switch between them using the dropdown.
- URL Bar: Displays the final URL that will be called. You can click to copy it directly.
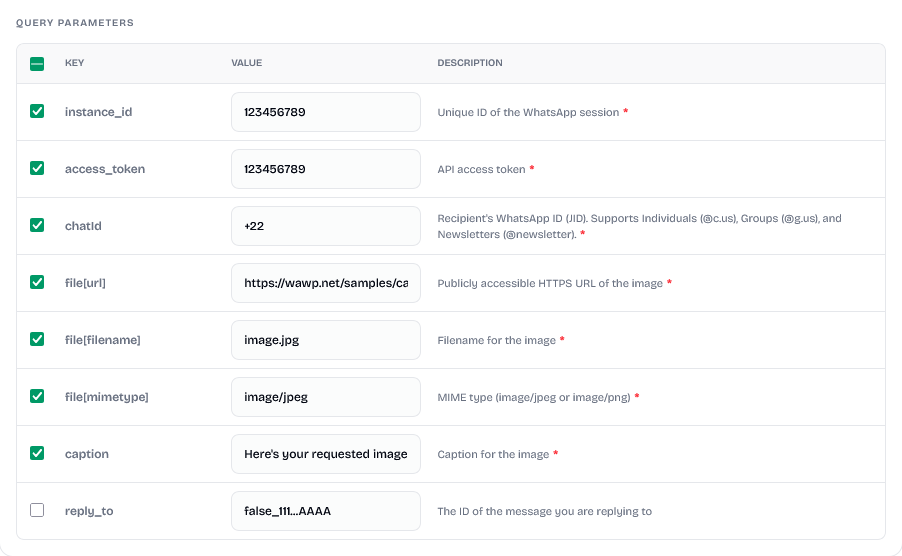
- Parameter Tabs:
- Params: Configure Query parameters or Body fields.
- Headers: View or set required headers like
Authorization.
- The "Send" Button: Click the Send button (or the Flask icon) to execute the request.
🧪 2. The API Sandbox & Global Variables
To make testing easier, we've implemented a "Live Sandbox" feature. Instead of typing your instance_id and access_token for every single endpoint, you can set them globally.
Setting your credentials:
- Look for the API Sandbox panel (usually in the sidebar or top of the page).
- Enter your Instance ID, Access Token, and a Test Number (the target phone number you want to send messages to).
- Once saved, these values will automatically populate the input fields in every tester across all pages.
- Live Indicators: You'll see a green "Live" pulse next to fields in the parameter tables that are using your sandbox values.
📖 3. Additional Context: Beyond the Basics
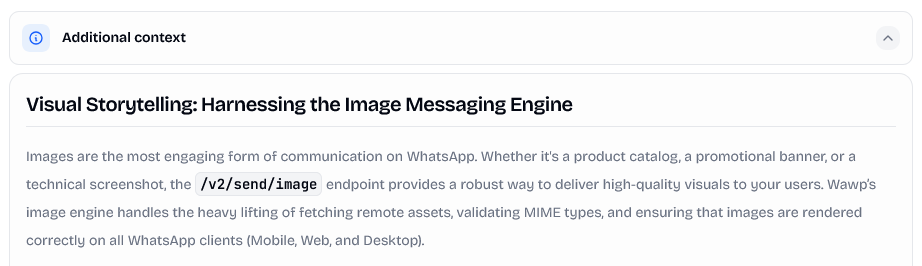
Most documentation just tells you what a parameter is. We tell you why it matters. Under the main description of an endpoint, you'll find the Additional Context (or "Narrative Power") section.
What's inside:
- Architectural Deep Dives: Explanation of the underlying logic (e.g., how we handle message queuing).
- Optimization Tips: Specific advice on how to achieve 99.9% uptime.
- Strategic Patterns: High-level designs like "The Auto-Heal Pattern" or "Optimistic UI Updates."
💻 4. Request Samples: Code for Humans
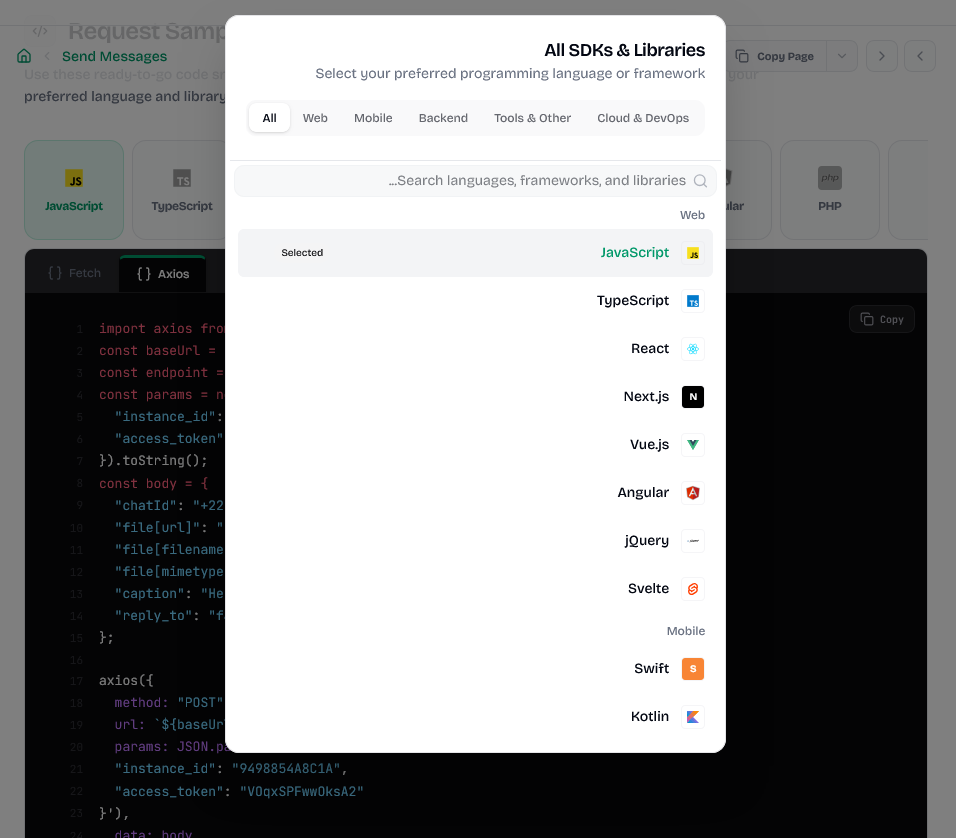
On the right side of the page (or below the parameters), you'll find the Request Samples section. This is your one-stop shop for implementation.
Features:
- Language Selection: Switch between JavaScript, PHP, Python, Go, C#, and more.
- Library Variants: For each language, we provide multiple methods (e.g., for JavaScript, you can choose between
fetch,axios, orjQuery). - One-Click Copy: Use the copy button to grab the code and paste it directly into your IDE.
- Dynamic Content: The sample code updates in real-time as you type into the interactive tester.
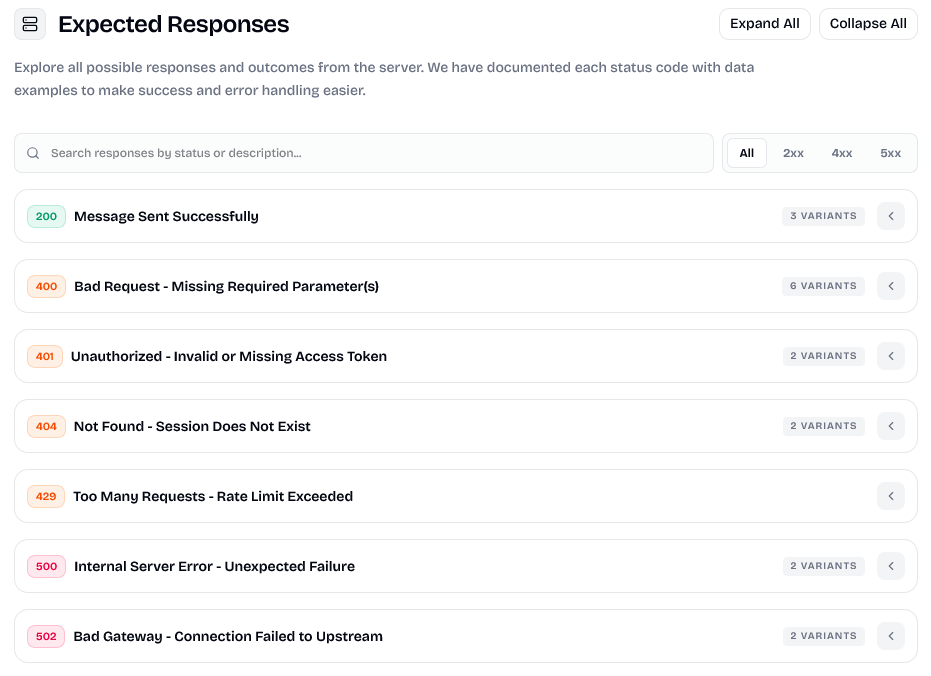
📥 5. Expected Responses: Success & Failure
Understanding what the server returns is crucial for error handling.
How to read them:
- Status Codes: 200 for Success, 400 for Client Errors (missing params), 401 for Auth issues, and 500 for Upstream errors.
- Schema & Examples: Each status code shows a JSON example of exactly what the API will return.
- Filtered View: Use the search and filter bar to quickly find specific error codes like "400".
💡 Pro Tips for Fast Integration:
- Sync with Webhooks: Always use the Webhooks Lifecycle to learn how to receive real-time updates (like message delivery statuses).
- Master Messaging: Check the Messaging Guide for details on sending images, videos, and interactive polls.
- AI Integration: If you are using Cursor, Windsurf, or Claude, follow our MCP Guide to connect these docs directly to your AI.
- Use the Search: Press
Ctrl+K(orCmd+K) to instantly find any endpoint or guide. - Dark Mode: Toggle the theme in the top right—our docs are designed for high-contrast late-night coding sessions.
Need more help? Our engineering team is available 24/7 via the "Talk to Us" button in the navbar.
Command Palette
Search for a command to run...